Being average is great until it’s not. For an engineer or scientist, a predictably average data point means the task is complete. We even count how many data points are a certain distance from what we want, our job being to make sure nearly none of the points in the herd stray too far. There was an exercise in college involving marbles and tracks meant to give us students an appreciation of all this. So how does the seemingly random tend to an average? (This also left some of us commiserating about our choice of major. An introduction to statistics and distributions followed the little game of marbles.)
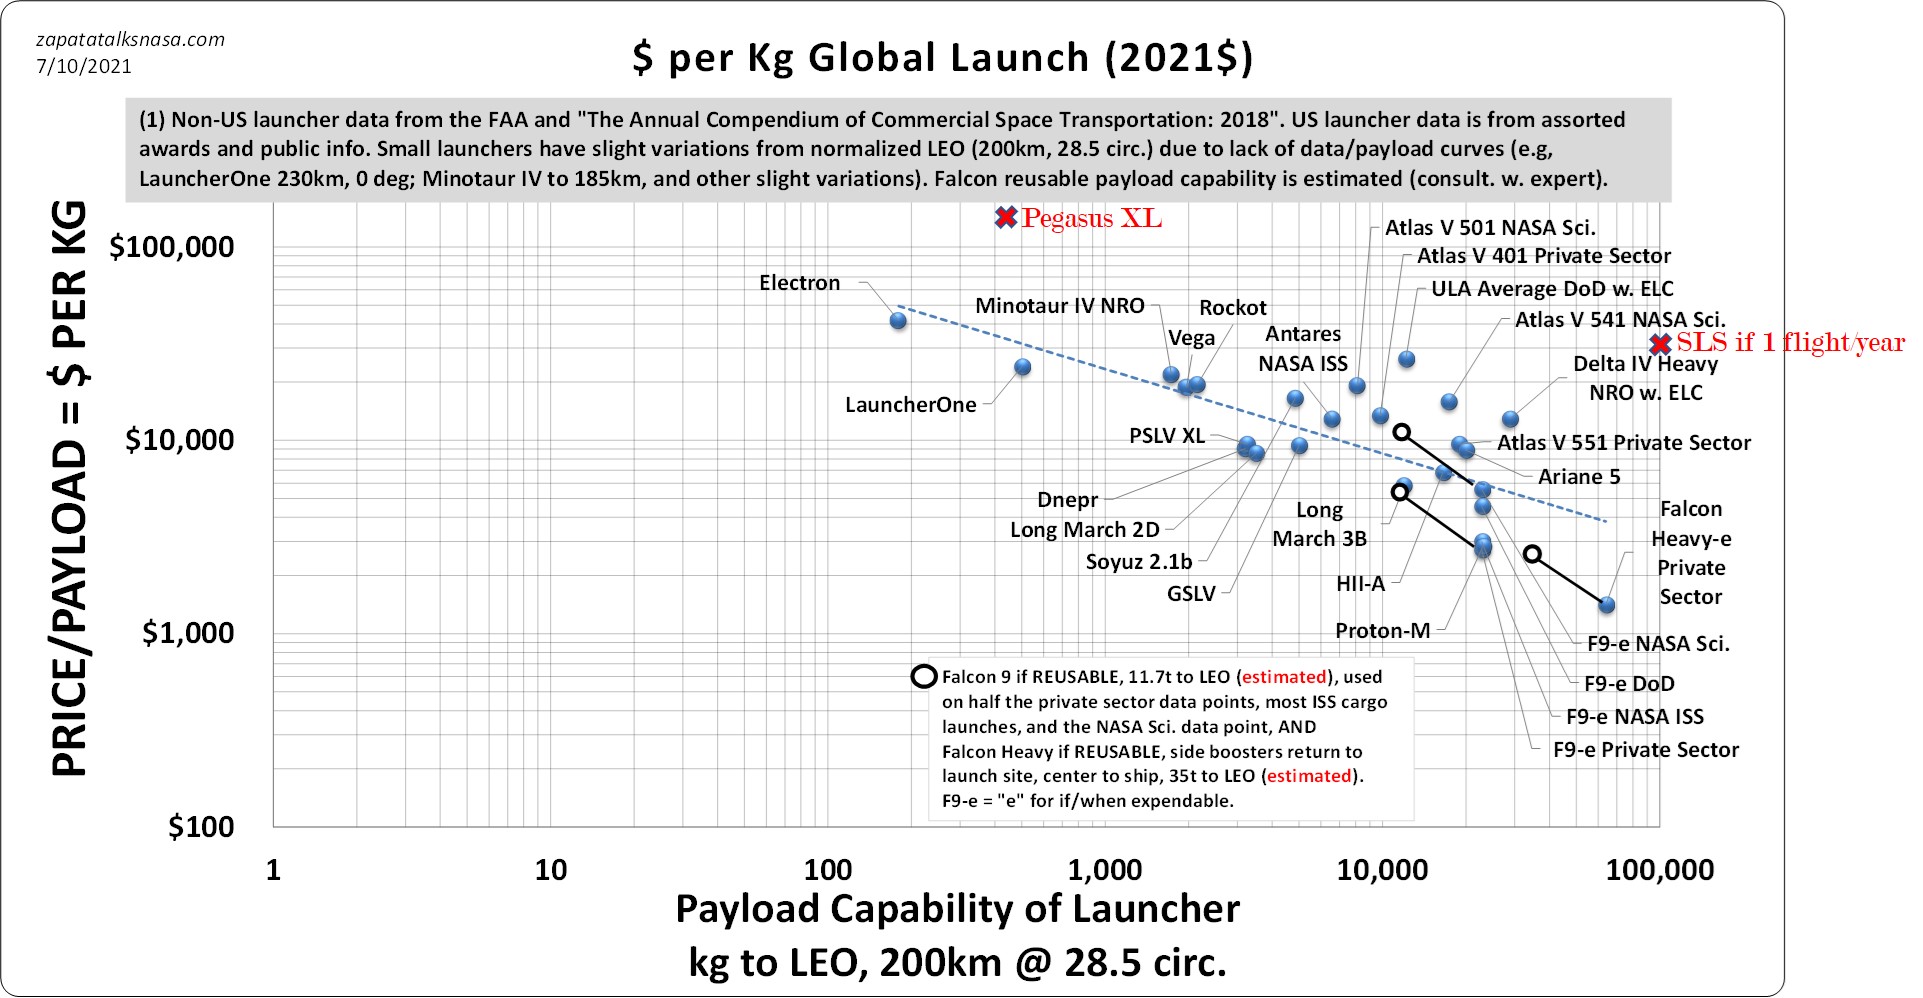
Our launch business commonly frames itself in a graph showing the price of each rocket divided by its payload capability. (Google images of “rocket cost-per-kg” or “per-pound.”) This graph is the rocket science version of the “price per ounce” on the label at the supermarket, helping us decide if we should buy the large jar or the small one. As a rule, there would seem to be some “averageness” to points in this graph; for a particular size rocket, there is a typical cost per kg. Also, as a rule, you should get a better deal buying the jumbo size. Though perhaps good rules of thumb once upon a time, these no longer seem to hold.
Recently, data points have strayed far from a predictable line. Yet, in this case, scattering is a good thing. There are times in engineering and technology that we do not want to be average. We want to deviate from the norm; it means something is changing that we want to change. So when the marble keeps falling far from where it usually landed before, something in the underlying setup is different.
Yet deviating from the average on purpose is not always easy, and how to do it is not always obvious. In real life, far removed from data, it’s not hard to find a sense that just the will to change can be enough to step off a trendline. After all, predictability speaks to a sense of fate, a loss of control, and there is a strong temptation to simply oppose anything inevitable as undesirable.
A case in point – it was some time after the loss of Columbia, and there was a meeting about scheduling. It was clear by then that the remaining Space Shuttle flights would only be to finish the construction of the International Space Station. Somehow, I got invited even though my duties in the Shuttle program had ended years earlier, mainly as one view on scheduling involved numbers and math and predictions about time and effort, which was still in my field (now for things to come, not the Shuttle). I settled into my chair, wondering if I should have sat this one out, attending to something less predictable. The topic was how long it would take us at Kennedy to launch twenty-two more Space Shuttles. The first expert wrapped up with the usual averages, calculations, and details I was familiar with, down to the spreadsheets and their rhyme and reason. The answer was predictable, give or take a decimal, and some reasonable disclaimers. You could expect to launch no more than five Shuttle launches a year.
The tone of everyone’s voices had gone up a notch.
Then, the meeting went south. The second expert presented a schedule task by task that could finish up the Space Station faster. (I can name that tune in three notes.) First, this was significantly more than five launches a year. Second, I was awake as the meeting I thought I would struggle through in need of coffee suddenly got heated. The tone of everyone’s voices had gone up a notch. Importantly, if every upcoming Space Shuttle launch clocked in at better than average, the question was simple – what are you doing differently? And why? If you wanted to break away from the crowd and the averages, you should list what was different in your plan. Alternately, you have no case.
The meeting did not end well. Before everyone goes up the chain of command with a consensus, there would need to be more meetings. I heard some muttering about agreeing to disagree. (Predictably, I sided with the group that had done the math, counted technicians, and knew how many troops they had for battle. Of course, there were statistics, too, and an assumption this was not the time for anything new.) Ultimately, these were merely curious questions and answers, affecting no decisions. This Q&A was about situational awareness, nothing more. Eventually, we finished constructing the Space Station with an average launch rate of about four launches per year. Predictably, the previous average had nowhere to go but down, caution being greater after the loss of Columbia, not less.
Creating a new rocket also requires estimating a specific effort, and as time and people are money, you get a cost per launch for a particular payload. Once upon a time, we saw Pegasus, ironically one of the first “commercial” rockets. We also know where the NASA Space Launch System will end up more or less (a relatively straightforward calculation for a “no less than” value.) For what that line is worth, these points are way above the trendline, as the scatter starts below (in statistics, the “fit” is not too good.) We also see that even for reusable Falcons, with less payload as you carry extra propellant and legs to come back, we move far off the predictable line – only now down and in the right direction. LauncherOne and Electron have done this as well, where once the Pegasus resided.
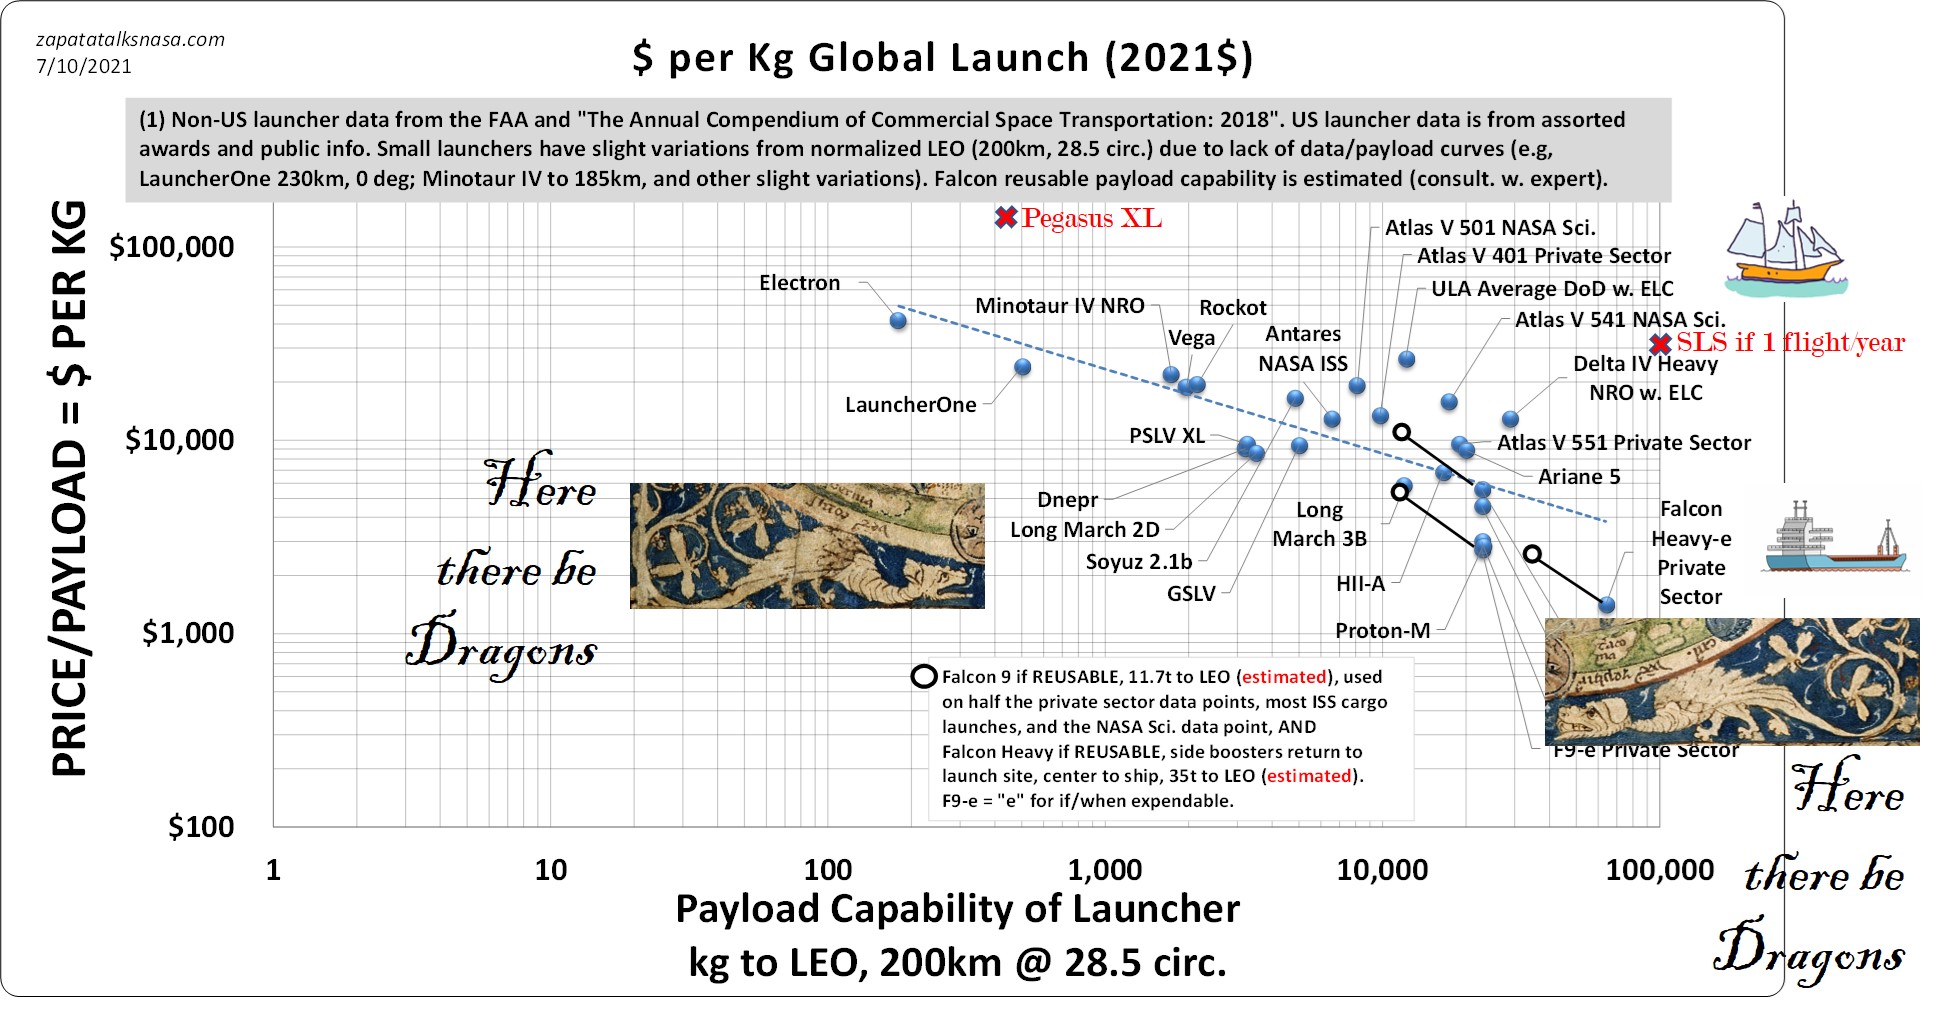
Perhaps we should look at dollars-per-kg graphs as if they were vintage maps. There are ocean currents, continents, and islands. We look at small rockets to come or to the territory where large payloads enter the realm of only hundreds of dollars a kg. We should mark these areas as uncharted and say, “Here there be dragons.” One day, we may think those old maps are so quaint.

One thought on “Here there be dragons”