For my accompanying blogs, see:
- NASA’s (really) declining budget, April 8, 2021
- Inflation, NASA’s budget, and ambition, April 8, 2022
- The NASA budget – running in place or getting ahead? April 25, 2023
…and a comparison of inflation indexes

Notes:
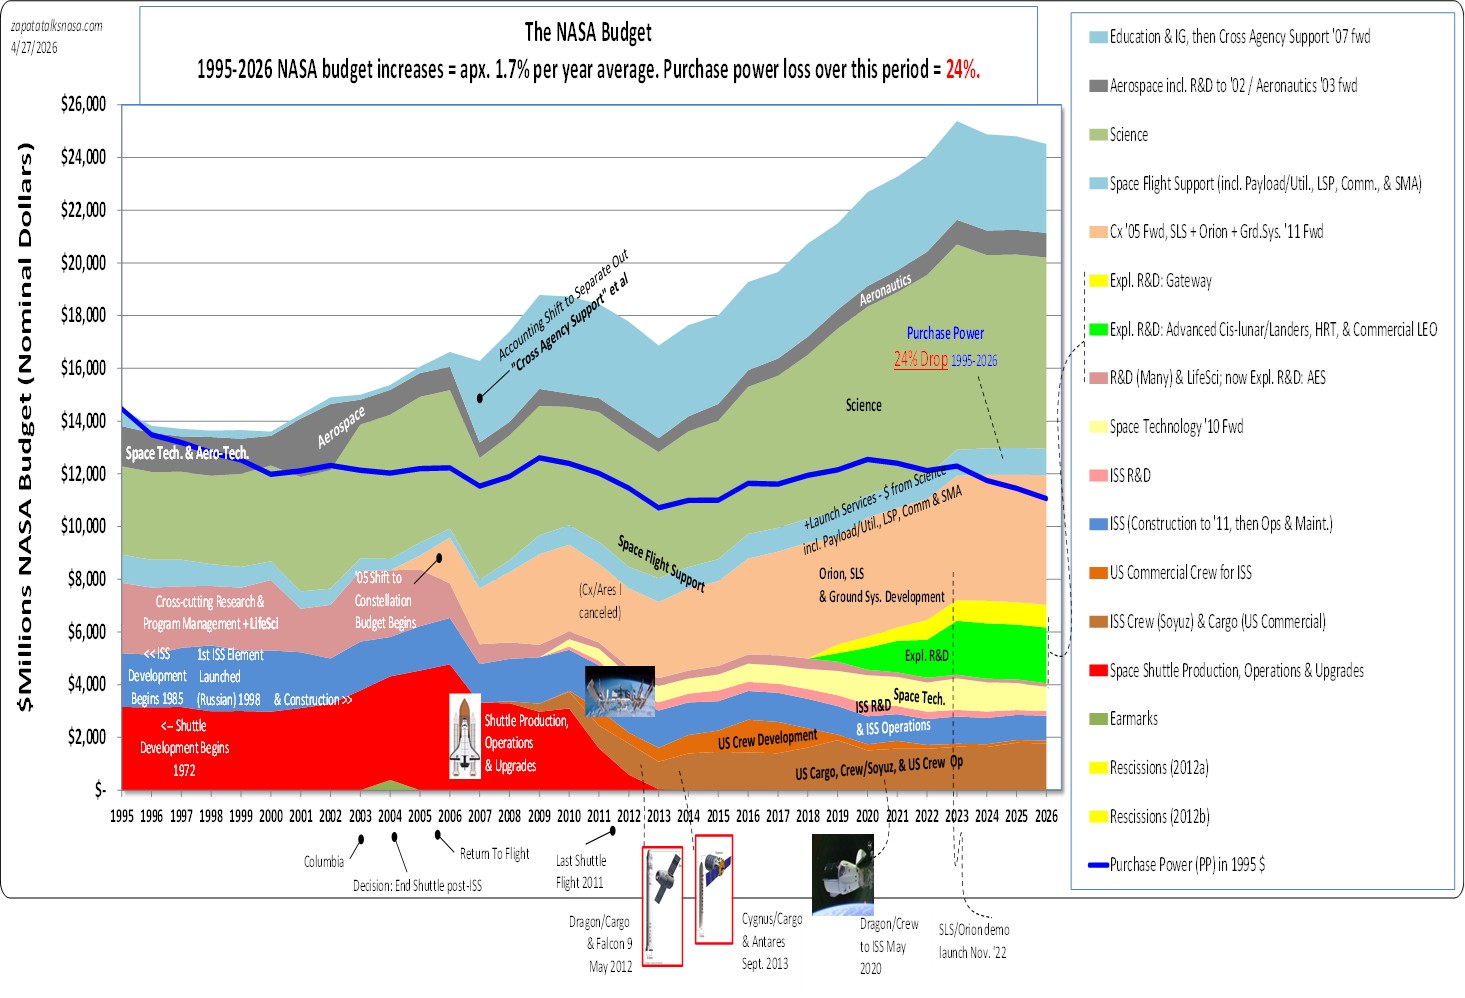
- The purchase power line (the blue line, “Purchase Power (PP) in 1995 $”) was calculated using the latest 2022 NASA Inflation Tables.
- A dollar in 1995, using the general US inflation index, would be worth $2.17 today for the same purchasing power, or, using the NASA inflation index, $2.23.
- NASA would need a little over $2.23 in 2026 to purchase what $1 purchased in 1995.
- That is, a NASA budget that kept up with inflation today would be just over twice the 1995 budget of $14.5 billion.
- But, NASA’s 2026 budget is less than this equivalent purchasing power.
- NASA’s budget, to have the same purchasing power in 2024 as in 1995, should be about $32 billion, but instead it is $24.5 billion, or 24% less.
- In 2021, the Biological/Physical Science line was moved from inside the ISS R&D line to inside the Science line. This was not a one-for-one transfer, as the ISS R&D line dropped twice as much as the Science line increased.
- Commercial LEO: 2020 $15M, 2021 $17M, 2022 $101.1M.
