For my accompanying blogs, see:
- Reusability, priceless, April 14, 2021
- Commercial launch trends – what do you see? August 22, 2022
- Three graphs and a truck, August 23, 2023
The data (MS Excel) > SoP Falcon Reuse Data Zapata as of 04-26-2026 launch.xlsx

What is this graph above saying?
SpaceX regularly turns boosters around to fly again in about 40 days. Steadily, for years now. (Lower black dashed trend line.)
SpaceX booster reuse has recently seen a boost, trending recently at over 15 reuses per booster. This is a combination of new boosters coming online (zero reuses), and some purposely expended boosters, pushing the trend down, and some boosters seeing much more reuse. (Upper black dashed line.)

What is this graph above saying? The reuse of most Falcon 9 boosters is “less than” the high twenties. A few boosters have been reused more.
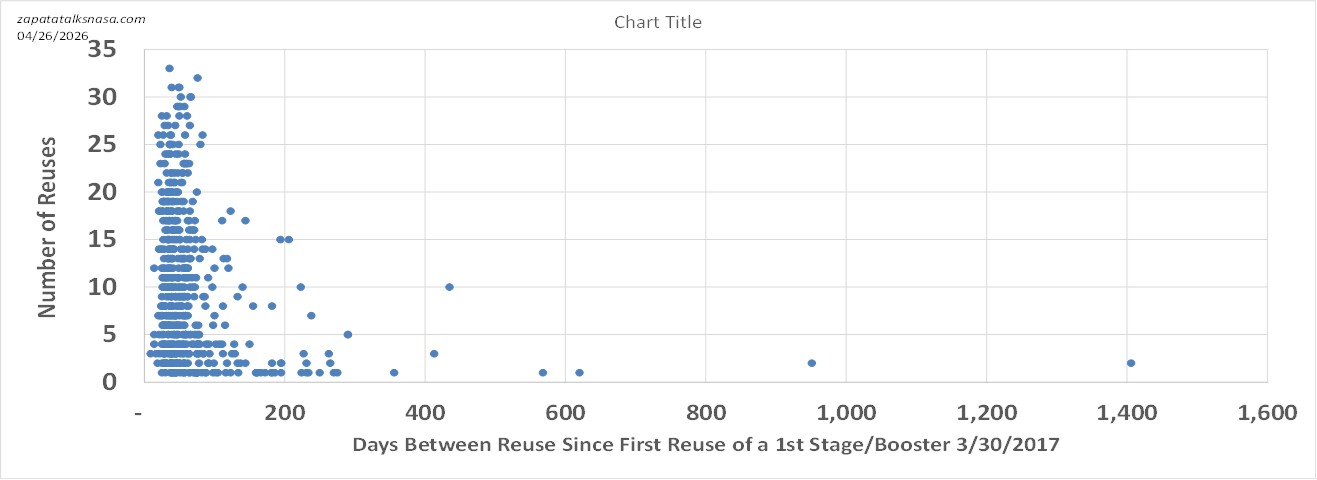
Graphs comparing the number of times a Falcon 1st stage/booster is reused to the time it takes to fly again.
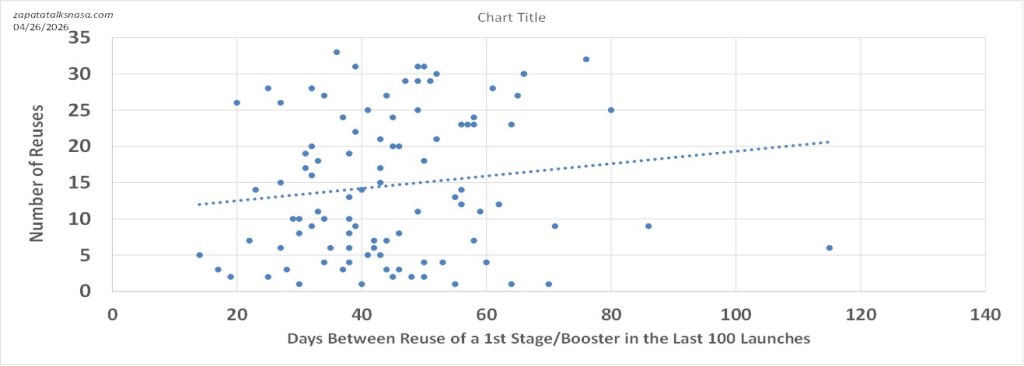
What are these graphs above saying? Curiously and counterintuitively, data since the first reuse of a Falcon 1st stage/booster tends to a wider range of turnaround times as the booster is newer (Upper graph). This may be due to booster reuse being in its early learning phases. Then, as a booster is processed repeatedly, it becomes more mature, with less variance. By looking at only the last 100 launches (lower graph), we see the expected (if weak) correlation between the number of reuses of a 1st stage/booster and its turnaround time – more reuse meaning more turnaround days next time, more wear and tear.

