Curious minds want to know. If we look at the time it takes SpaceX to reuse a first-stage/booster, the days between one launch and a relaunch, and the number of times that booster is reused, what do we see? Surely some SpaceX employee has looked at this, too. Though I’m reminded of a time decades ago when I asked about the data for the Space Shuttles, Discovery, Atlantis, and so on, and what parts failed most often from launch to launch. It became apparent at the start that the data we wanted was not collected, at least not in a useful format that would answer the question.
But back to SpaceX, boosters, and reuse. The curiosity. If we look at all the data since SpaceX first reused a 1st stage/booster (March 30, 2017), up till a recent launch (February 7, 2026) and compare the number of reuses to the turnaround times, we see (1) that the newer a booster, the wider the range of turnaround times, and (2) that for recent launches (the last 100) the pattern disappears, and scatter seems to take its place.
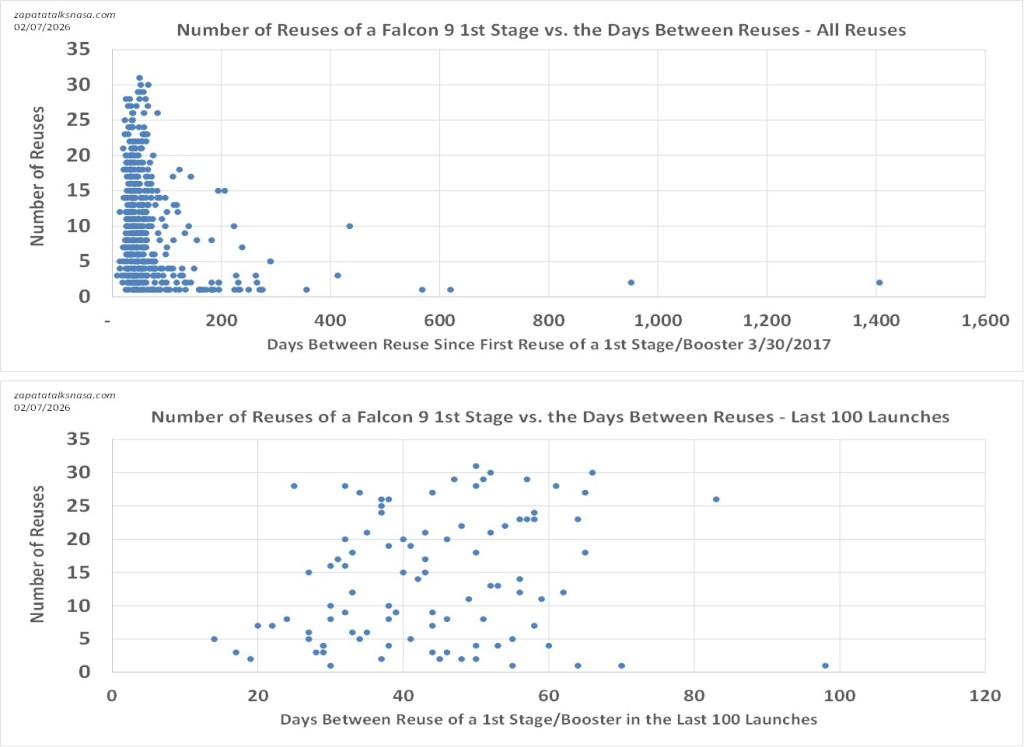
Intuitively, a “hypothesis” would say that the more you reuse your boosters, that is, the older they are, the wider the range of turnaround times you will see. More parts to replace before putting them back on the line for a launch. More parts R&Rs (removals and replacements) take more time, and so on, variations on the theme of more reuse as increasing wear and tear.
But the opposite would seem to be true, lending credence to the old notion that a customer would prefer a “proven” booster to a “new” one. The “proven” one is a booster that has demonstrated its manufacturing and flight characteristics, versus a “new” booster that might hide surprises.
Or so goes the notion.
Yet, this begs a question. The notion of “proven” as better than “new” would imply a variance in initial manufacturing, which is inconsistent with the Falcon launcher’s demonstrated reliability. So, is this an artifact of looking too far back? Of having too much data? Of seeing an earlier, immature operation vs. a more routine, mature current operation?
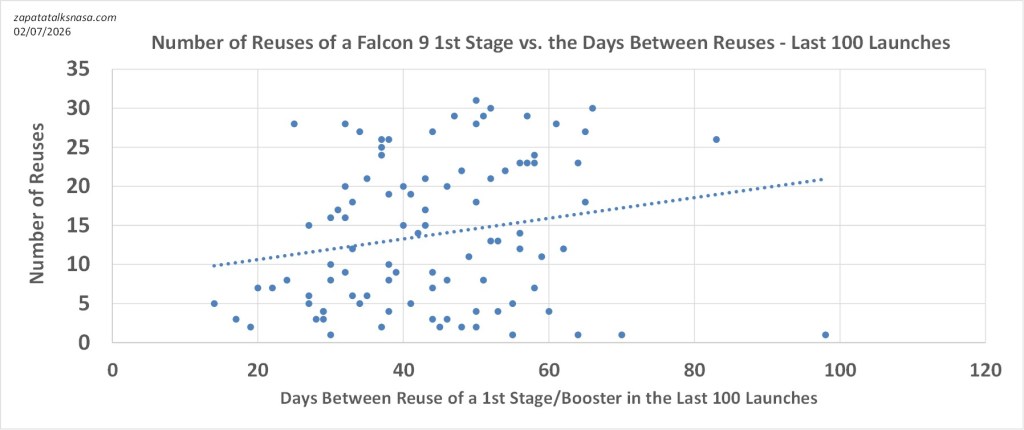
Possibly. In the last 100 Falcon launches only, the pattern of less reuse having a wider turn time mostly disappears. Mostly. Points at the bottom of the graph are still slightly more spread out than those at the top. But the obvious pattern seen looking back further mostly disappears when looking at the most recent operations. A new pattern does appear, also very slight, supporting the original notion of more reuse meaning a slightly longer turn time – the wear and tear hypothesis. Notice the ever-so-slight leaning of the points, more to the right as reuse increases (confirmed by a trendline).
I’m reminded of the eventual answer to my long-ago questioning about Shuttles and the parts we changed out more often from flight to flight. We got a non-answer of sorts. There was no obvious pattern. No easy answers. Not in the quantity of parts we R&R’ed between flights, or which specific parts would more likely require replacement. So much for my youthful attempt (over many years) to use data to predict parts likely to fail. Though teams assigned to the newer orbiters, Endeavour and Atlantis, said these were less finicky than the oldest orbiters, Columbia and Discovery. (Yes, that’s an engineering term, along with “fussy.” Columbia always was the Galactica of the fleet.)
The reasons behind this are convoluted. Likely, we were constantly interfering with the experiment, already putting in more effort and care beforehand, where we believed problems would likely arise. A process that began long before I arrived. We also discovered that paperwork might classify a replacement as regular maintenance. Again, the notion of preempting failure was built into the system.
The more interesting explanation is surreal. That we only found problems where we looked, and that if you looked hard enough, you would always notice something amiss, making integrated testing (tests fully stacked in the weeks before launch) all the more important. That is, our maintenance always looked for our lost keys only by the light of the lamp post. Throwing a wrench in the works, paperwork systems geared to managing the flow of work did not care about the collection of data. This was not the LabCorp app plotting your cholesterol over the last five years.
No orbiter would operate up to its design life of 100 flights. Discovery would see 39 flights, Atlantis 33, Columbia 28 (lost), Endeavour 25, Challenger 10 (lost), and Enterprise 0 (used only for glide tests). Though I am sure if the Shuttle program had kept going, we would all be talking about the ships of Theseus by now.
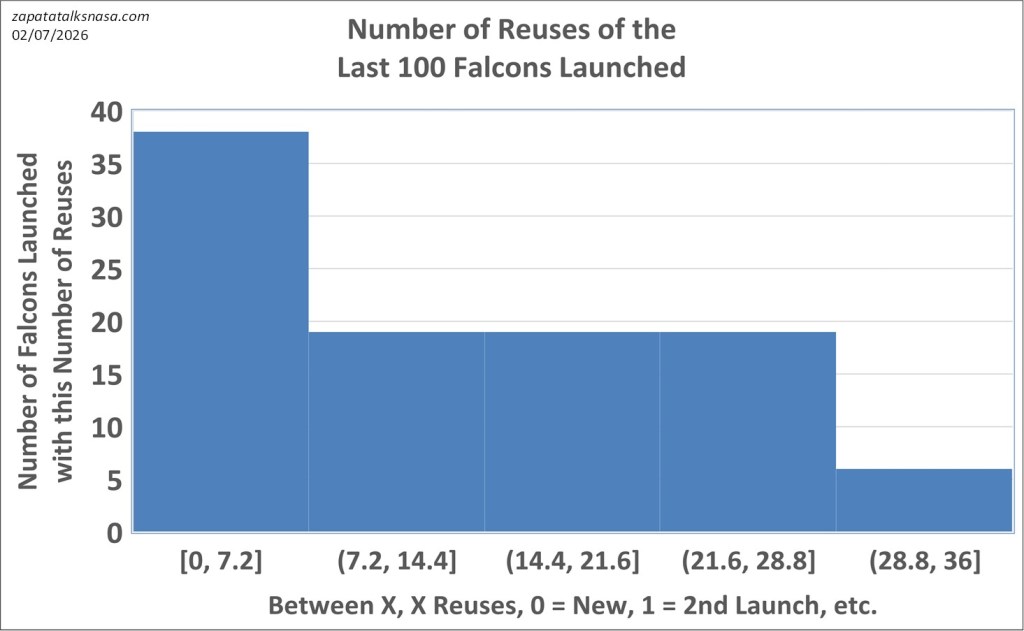
Falcon 1st stages are also seeing high numbers of flights, with caveats. While a look at the number of reflights suggests boosters are reused into the high twenties, a stricter statement would be “most” Falcon 1st stages see “less than” twenty-nine flights. (The average reuse across the last 100 launches is much less, thirteen flights.)
Time will tell the shape of rocket reusability data to come, and the stories, maybe in five years, with Starship? Seven? We can always hope that is the problem, obscure patterns, the bookkeeping of so much data, and what small pieces of valuable knowledge we can wrestle from it all. Remember, it’s knowledge that has come at great cost.
Oh, and an update to some of the other usual graphs, where you can also see older blogs related to these.
Global commercial orbital space launches
